
Leading vs Lagging Indicators Is the Most Misused Idea in Product
Most teams track the right numbers just too late to matter.

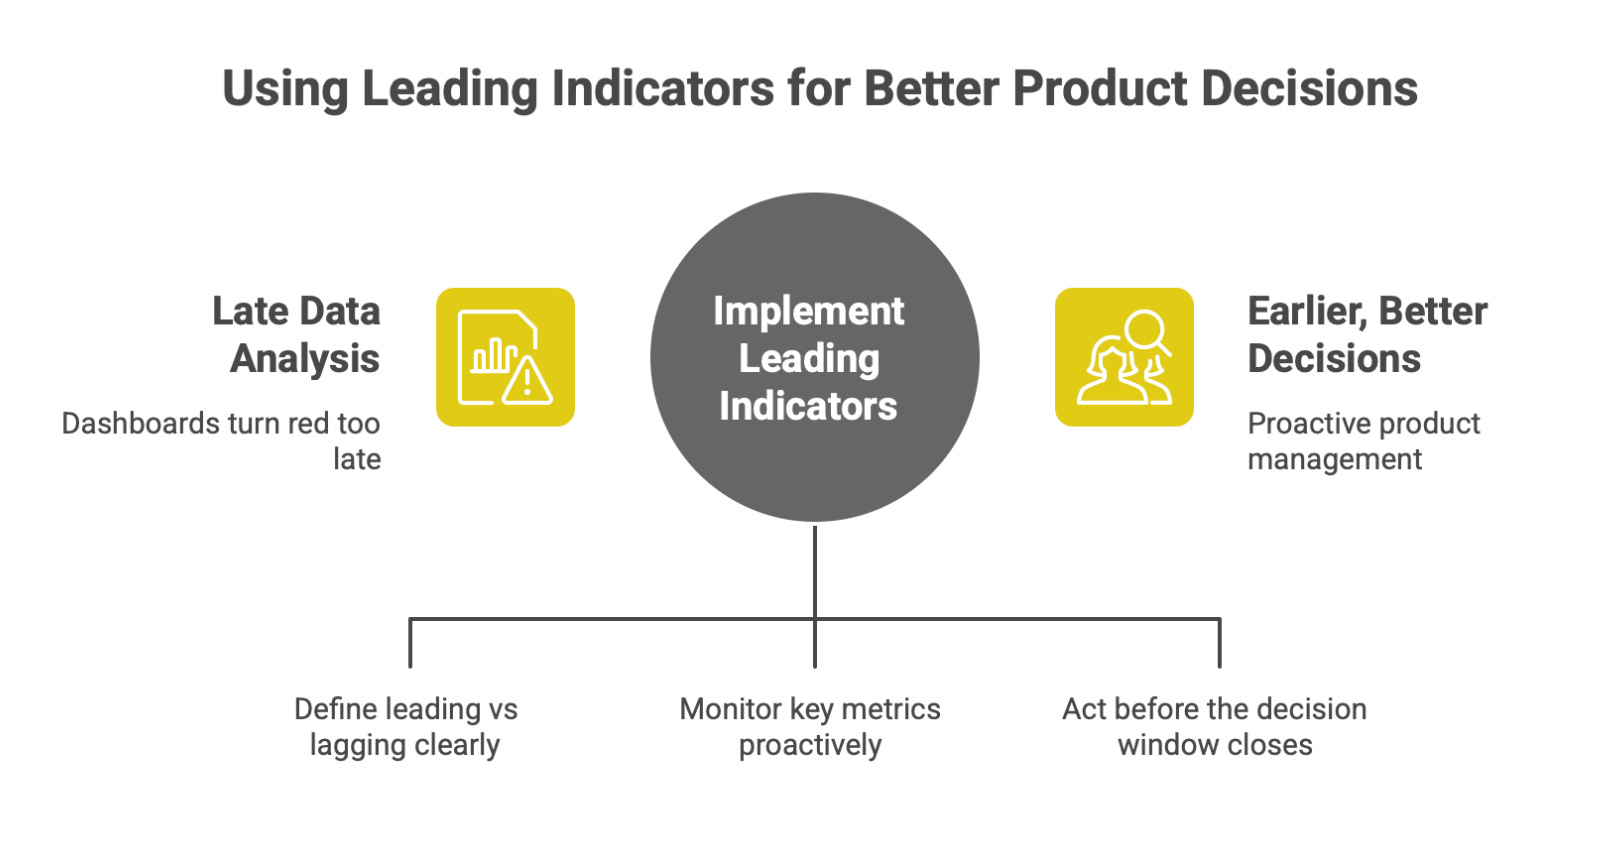
Most product teams aren’t failing because they lack data.
They’re failing because they’re looking at the right numbers too late.
By the time their dashboards turn red,
The decision window is already gone.
“Leading vs lagging indicators” is one of the most quoted ideas in product.
It’s also one of the most misunderstood.
Teams talk about it.
They label charts with it.
They still make bad decisions.
This post explains what leading and lagging indicators actually are, why product teams misuse them, and how to use them correctly to make earlier, better decisions.
The Simple Definition (That People Still Get Wrong)
Let’s get this straight.
Lagging indicators tell you what already happened
Leading indicators tell you what is likely to happen next
That’s it.
But here’s the mistake:
Teams assume any “early” metric is a leading indicator.
It’s not.
Time alone does not make a metric “leading”.
Why This Concept Matters So Much in Product
Product decisions are:
expensive
slow to reverse
delayed in impact
By the time lagging indicators move:
users have already churned
behavior is already baked in
damage is already done
Lagging indicators are great for post-mortems.
They are terrible for steering.
Leading indicators are how you:
catch problems early
validate direction before scale
change course while it’s still cheap
What Lagging Indicators Actually Are
Lagging indicators measure outcomes.
They answer:
“Did it work?”
Examples:
revenue
retention
churn
NPS
DAU/MAU
conversion rate
They are:
reliable
easy to explain
comforting to leadership
They are also:
slow
backward-looking
impossible to act on quickly
What Leading Indicators Actually Are
Leading indicators measure behaviors that cause outcomes.
They answer:
“Is this likely to work?”
Examples:
first-week activation behavior
repeated core action usage
time-to-first-value
depth of feature usage
frequency of return without prompts
Leading indicators are:
predictive
directional
uncomfortable
harder to define
And that’s exactly why teams avoid them.
The Most Common Product Mistake
Most teams do this:
These metrics change after behavior has already shifted.
They confirm reality.
They don’t shape it.
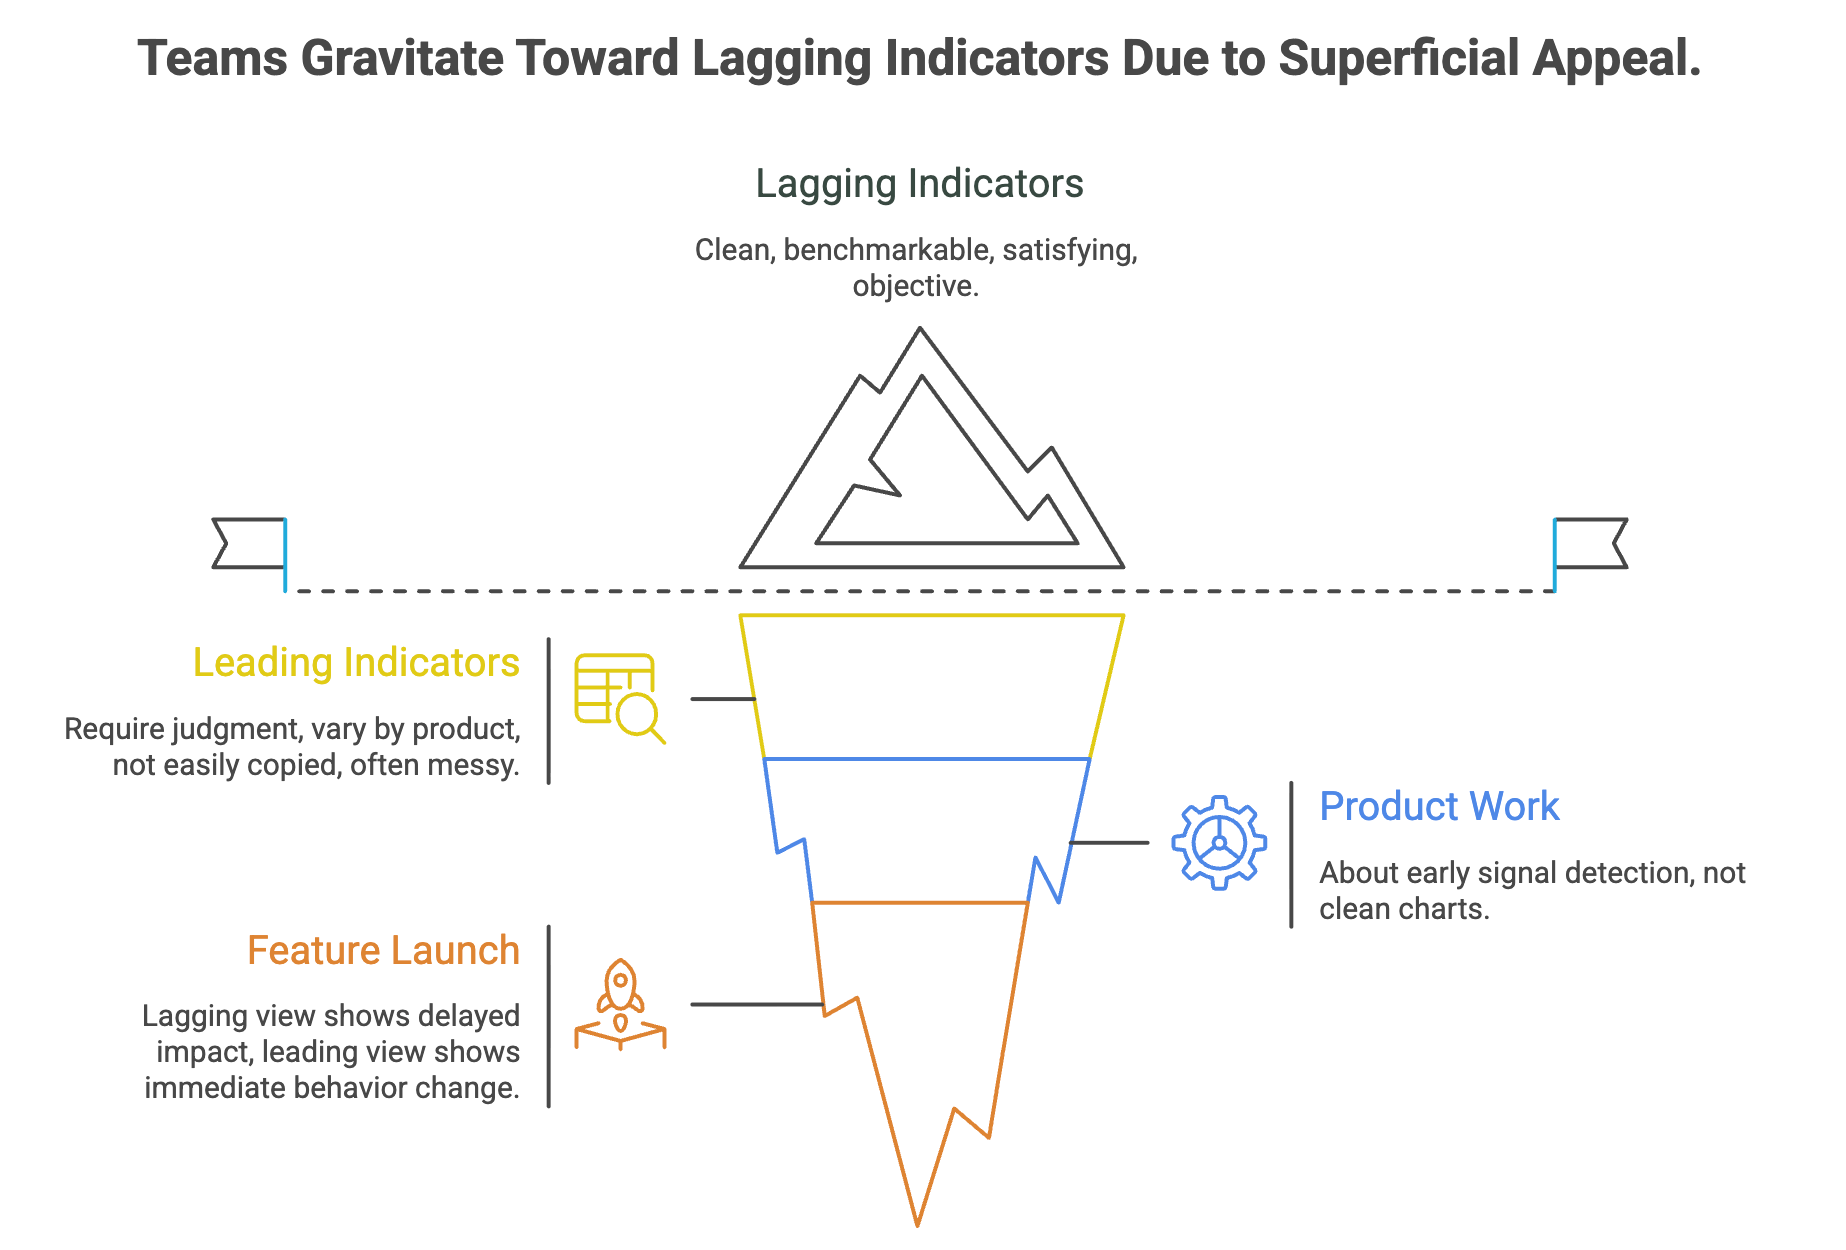
Why Teams Gravitate Toward Lagging Indicators
Because lagging indicators:
look clean in dashboards
are easy to benchmark
satisfy stakeholders
feel objective
Leading indicators:
require judgment
vary by product
can’t be copied from blogs
often look “small” or “messy”
But product work is not about clean charts.
It’s about early signal detection.
A Concrete Example: Feature Launch
Scenario
You launch a new onboarding flow.
Lagging view (what most teams track):
Week 4 retention
Conversion rate
Revenue impact
By the time these move:
users have already formed habits
bad flows are entrenched
fixes are reactive
Leading view (what actually helps):
% of users completing the first meaningful action
time taken to reach that action
drop-off points during setup
number of users returning without reminders
These metrics tell you:
“Is this onboarding changing behavior right now?”
The Leading–Lagging Chain (The Mental Model)
Think of product metrics as a chain, not a hierarchy.
User behavior → Leading indicators → Lagging indicators
Lagging indicators are the result.
Leading indicators are the cause.
If you only track results,
you are managing by autopsy.
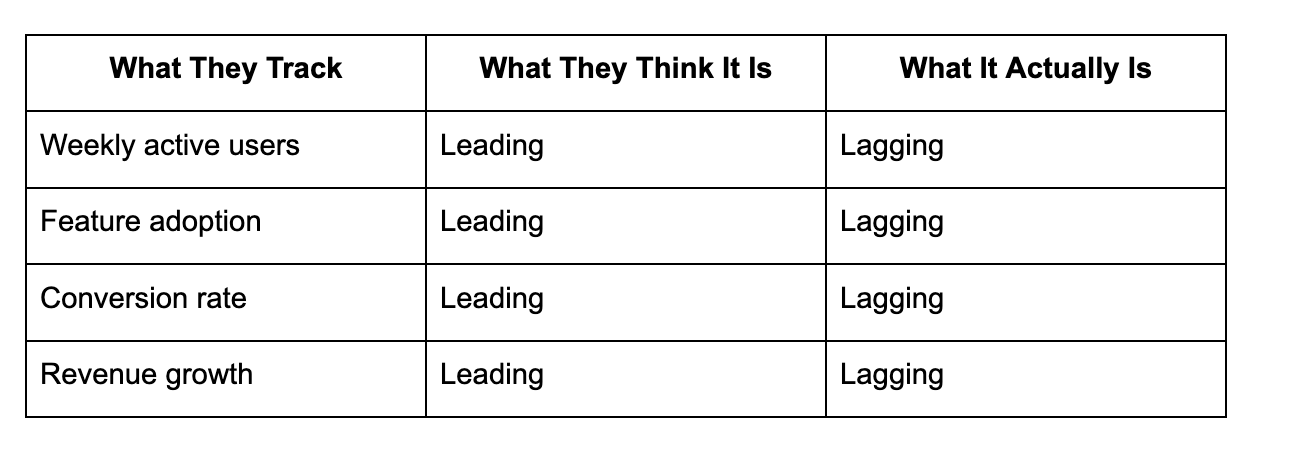
Why “Early Metrics” Are Often Still Lagging
This is subtle but critical.
Example:
Day 1 retention
It feels early.
It is still lagging.
Why?
Because the behavior that caused Day 1 retention happened before the metric was recorded.
The real leading indicators were:
whether the user experienced value
whether the product solved a problem
whether the user formed intent to return
Retention just confirmed it.
What Good Leading Indicators Look Like
Good leading indicators are usually:
behavioral, not attitudinal
specific, not aggregated
actionable, not descriptive
proximal to value creation
Bad leading indicators are usually:
vanity metrics
counts without context
activity without meaning
Example: Lagging vs Leading (Product Table)
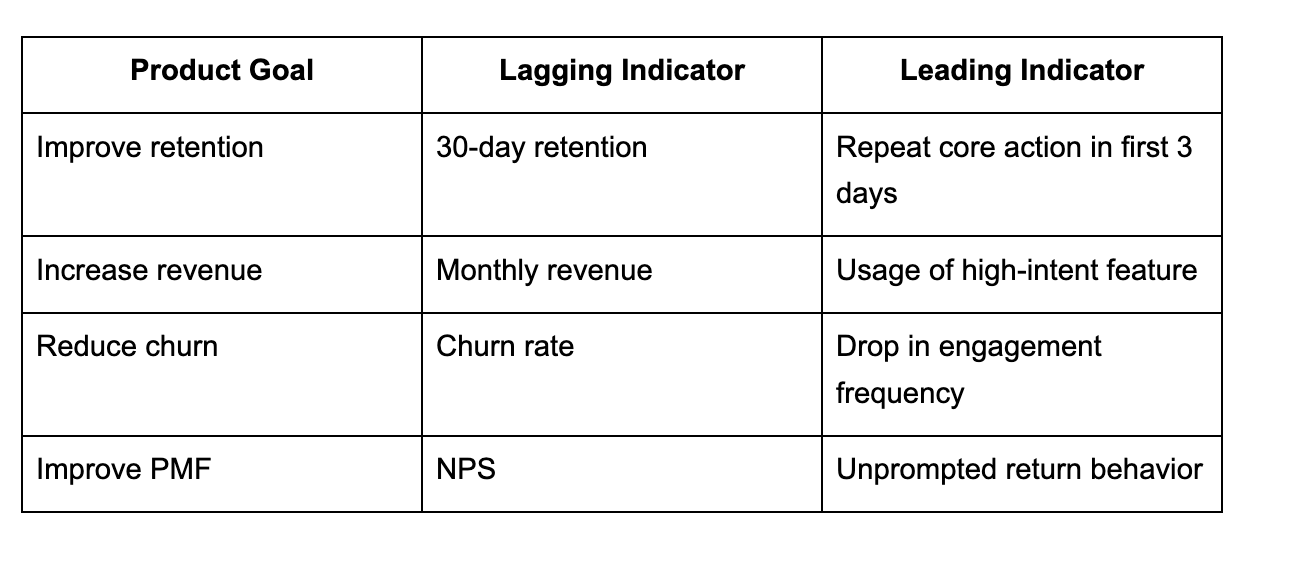
Notice something:
Leading indicators are harder to measure but easier to act on.
Why PMs Misuse This Concept Specifically
Three reasons:
1 Pressure to Report Outcomes
Leadership wants results.
PMs respond with lagging metrics.
But PM value is in early signal detection, not just reporting.
2 Fear of Subjectivity
Leading indicators require judgment.
PMs worry they won’t “hold up” in reviews.
But pretending lagging indicators are objective does not make decisions better.
3 Copy-Paste Metrics Culture
Teams borrow metrics from other products.
Leading indicators are product-specific.
They can’t be templated.
So they get skipped.
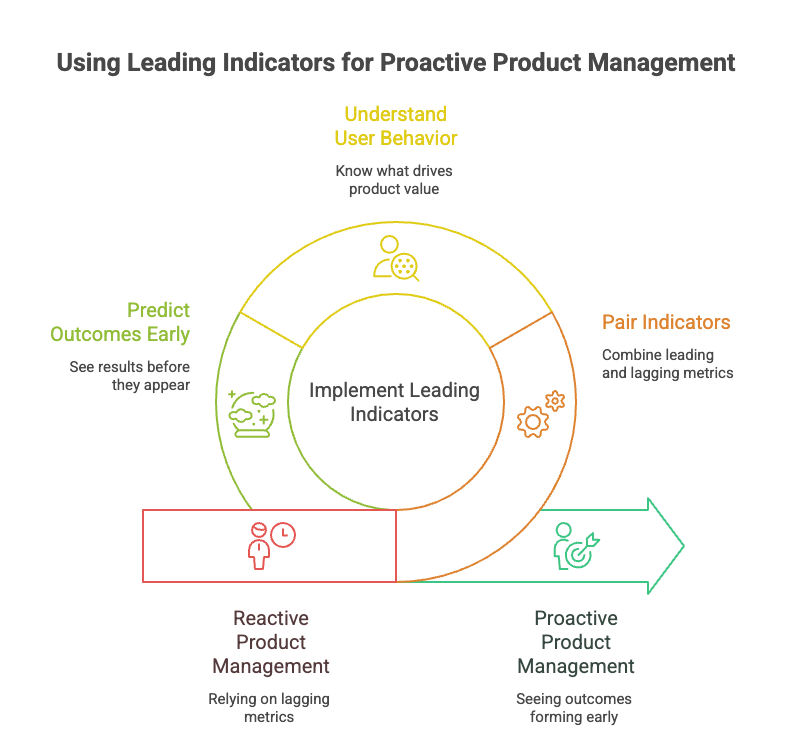
How to Use Leading & Lagging Indicators Together (Correctly)
You don’t choose one.
You pair them.
Rule of thumb:
Lagging indicators = validation
Leading indicators = navigation
A healthy product dashboard answers two questions:
Did it work?
Is it likely to keep working?
Most dashboards answer only the first.
The PM Skill This Concept Tests
Understanding leading vs lagging indicators is not about analytics.
It tests:
whether you understand user behavior
whether you know what creates value
whether you can predict outcomes before they appear
Strong PMs don’t wait for results.
They see outcomes forming early.
Lagging indicators tell you the story after it’s over.
Leading indicators tell you the story while you can still change it.
If your product decisions rely mostly on lagging metrics:
you will always be late
fixes will be reactive
surprises will feel constant
The best product teams don’t chase results.
They watch behavior.
Because behavior moves first.
Metrics follow later.
And product success is decided
long before the dashboard updates.